
On 28th June 2021, India’s most valued conglomerate Reliance Industries faced a 10 % upside in its stocks, after the charts formed a golden cross. What is this golden cross that caused the stock prices of Reliance share to push by 10%?
What is the golden cross strategy?
A golden cross strategy is a type of technical indicator or, to be precise, a chart pattern where a stock’s short-term moving average crosses a long-term moving average to move upside. Traditionally, investors consider the short-term moving average to be a 50-day moving average and a 200-day moving average as the longer one. However, investors are free to choose any time frame of moving averages. One also needs to note that the shorter the average time frame selected for moving averages, the more sensitive it is to the everyday price movement as it could lead to false positives or frequent price movement.
A moving average can be calculated by adding closing prices of stocks for the no. of days divided by the days. For example, a 50-day moving average is calculated by adding the closing prices of its stock for 50 days divided by 50. A crossover between the two moving averages indicates a bullish trend for the long term. It also means the 50-day moving average is trading higher than the 200-day moving average. Investors identify this crossover of moving averages to be a strong buy signal.
There are three stages to this golden cross strategy:
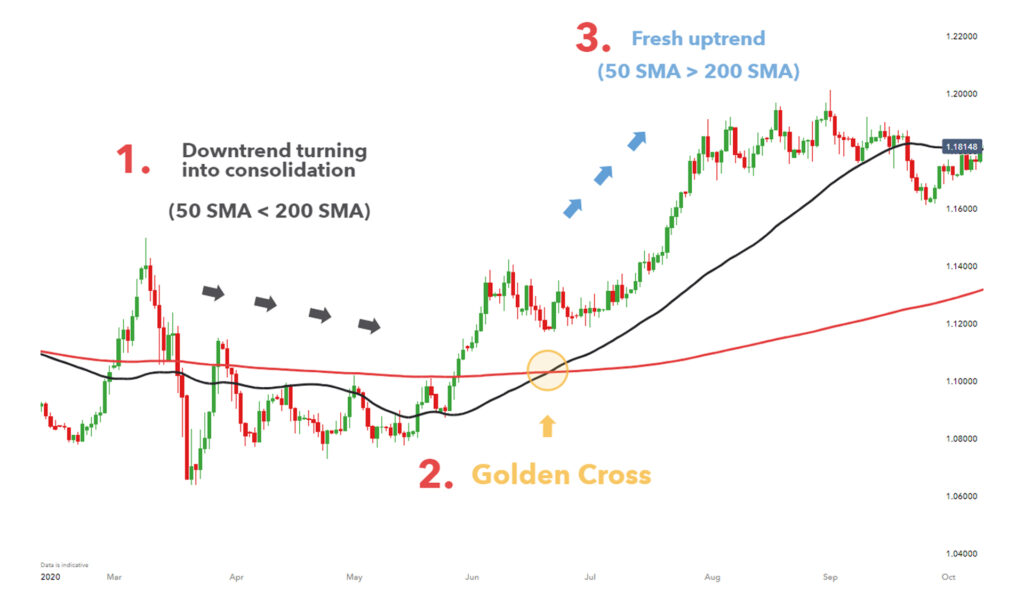
Downtrend stage: In this stage, the 50-day moving average lies below the 200-day moving average. At this, the selling interest of an investor is overpowered by a stronger buying interest.
Crossover stage: The 50-day moving or any short-term moving average crosses over any long-term moving average or the 200-day moving average. This is the point of the golden cross involving the emergence of an uptrend.
Uptrend stage: In this, the short-term moving average continues to be on an upward trajectory ushering in a bullish trend and higher trading volumes. The two moving averages here act as support levels where a declining stock will find a bottom and bounce up from. As long as the 50-day or short-term moving average remains above the 200-day average, the market remains unchanged from its bullish behaviour.
How should investors use the golden cross?
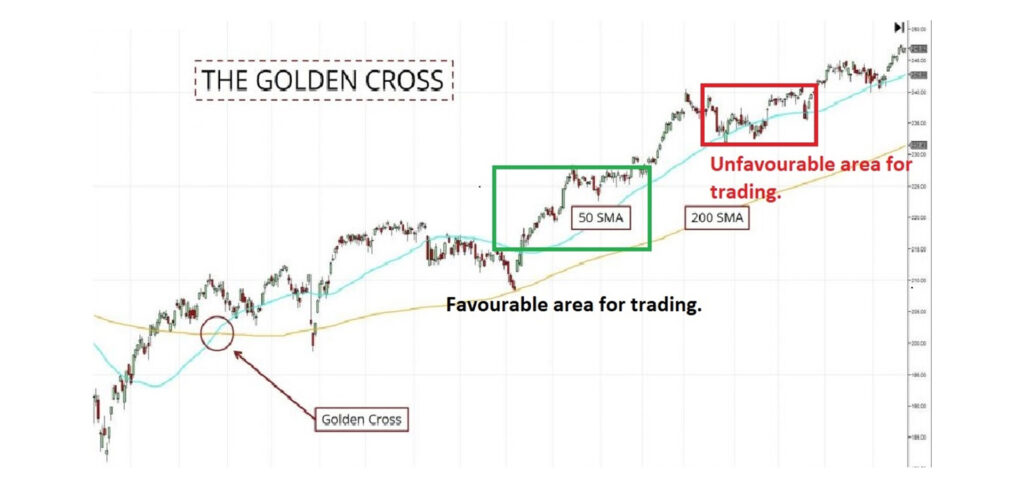
Several investors have shown haste in purchasing stocks as soon as the crossover takes place. But, the ideal price point to purchase stocks after the crossover will be the price surrounding the support levels or dip point. After the crossover, the stocks trade on higher levels and we should wait for the prices to fall, the fall in price is known as a dip. Purchase of stocks during dips is considered to be good as one can buy stocks at a lower price and is expected to give higher returns. The short-term moving averages act as the support level.
Investors also have a question about whether they can purchase stocks until the short-term moving average is above the long-term moving average, the answer is no.
Even though the short-term moving average line is above the long-term average, the ideal purchase area of stocks is the area available that lies above the short-term average trend. One should not look at purchasing stocks when the candlesticks are going below the short-term moving average trend though showing an upward trajectory. Purchasing at this point will attract losses.
This can be explained with the below image.
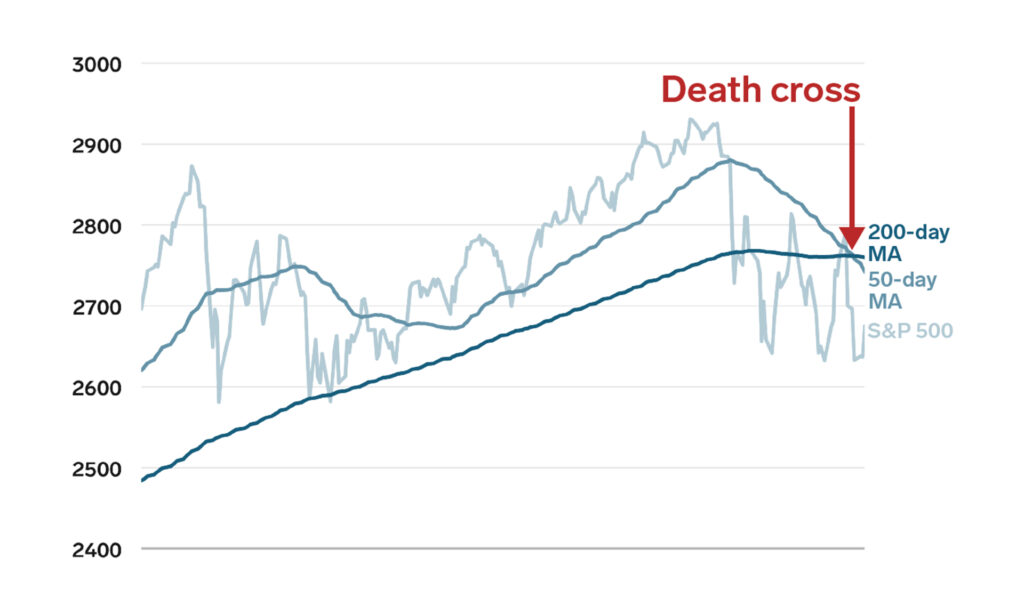
Death cross – the exit strategy
A death cross is the opposite of the golden cross, where the short-term moving average trend crosses the long-term moving average to go downward, signifying a bearish trend and indicating the potential for a major sell-off. During the death cross, the ideal price selling position of stocks will be when the candles show a slight rise and fall. But remember, in no way one should trade while candles are above the short-term moving average trend; stocks should be sold while it remains below the trend.
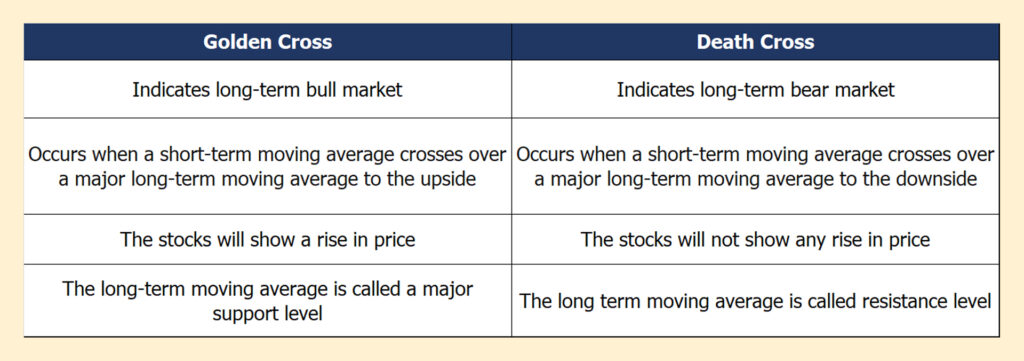
Golden cross vs Death Cross
‘‘
A golden cross strategy is a type of technical indicator or, to be precise, a chart pattern where a stock’s short-term moving average crosses a long-term moving average to move upside.
Word for the investors
A golden cross can sometimes produce false signals. In the case of the golden cross, investors should always confirm the bullish trend of a company with positive news in the market such as new products or services launched, positive earnings, debt paid off, etc. Another way to confirm the golden cross to be reliable is through trading volumes, as during the cross over the trade volumes are expected to be high showing higher participation. For every entry into trade, investors should have an exit strategy. Setting stop losses can help investors evade losses to a great extent.


