
What does it mean by Financial Statements?
When we hear the term ‘financial statements’ what comes to mind are three financial reports viz. Profit and Loss or Income statement, Balance Sheet and Cash Flow statement. These three statements hold a prominent position in the management of an organisation as they are statutory and hence mandatory reports that are to be prepared, get audited, filed with statutory and tax authorities, placed before shareholders in general meetings. These reports are required to be prepared annually and every quarterly in the case of listed or publicly held companies.
Financial statement analysis as a process uses analytical procedures to evaluate the financial health, risks, performance and future potential of a business. Even the smallest business should do financial statement analysis and can benefit from the results as a guide for the business owner. What level and type of analysis are required to be performed depends on certain factors; the form of the business, if publicly held, or if the business is for sale, for external parties like investors or for making their investing decisions.
Financial statements communicate the financial position and performance of a business for the consumption of the board of directors, senior management and external parties. The three most important financial statements that are generally used for financial statement analysis are:
- Profit and Loss Statement: This report shows an organisation’s financial performance over a period showing the revenue and expenses. It is called an Income statement in the US.
- Balance Sheet: The balance sheet shows an organisation’s financial position at a point in time. It shows the assets, liabilities, owner’s equity, as well as the company’s net worth.
- Statement of Cash Flows: The statement of cash flows shows the organisation’s cash inflows and outflows during any given period.
These reports are mandatory and at the same time very crucial for internal and external stakeholders. These are the reports that are reviewed and considered by investors while planning investment, lenders when evaluating credit applications, markets while considering portfolio investments, tax authorities for assessment of income tax returns among many other such uses.
Businesses, small and big, must be well informed of internal and external factors that affect their business to survive in a competitive and volatile environment, and one of the vital competencies they must develop is to read and understand important financial statements. Running a business without understanding these financial reports is like driving a car without a dashboard.
‘‘
Running a business without understanding the financial reports is like driving a car without a dashboard.
Users of Financial Statement Analysis
The various users of financial statement analysis include:
- Management of the company: The topmost priority of the board of directors and senior management is in the financial performance of their organisation. For the board and management, the finance department of the company does an ongoing analysis of the company’s financial statements, particularly operational metrics that aren’t seen by external entities.
- Investors: The prospective investors scrutinize the health of the organization by performing due diligence using analysis of the financial statements to understand the company’s ability to continue as a going concern, issue dividends, generate cash flows and ensure that the company continues to grow at least at the historical or current rate.
- Creditors: A creditor or anyone for that matter, who has provided funds to the company will be interested to know the ability of the company to pay back the debt and obligation, and their cash management measures.
- Regulatory authorities: In cases of publicly held or listed companies, the Securities and Exchange Board of India (SEBI) examines their financial statements to see if the statements conform to accounting standards as well as the SEBI rules and guidelines. In addition, financial statements are to be filed with ROC and Tax authorities.
- Shareholders or members: Audited financial statements are to be placed before shareholders in annual meetings and have to be adopted or approved by the shareholder members.


Performing analysis of financial statements
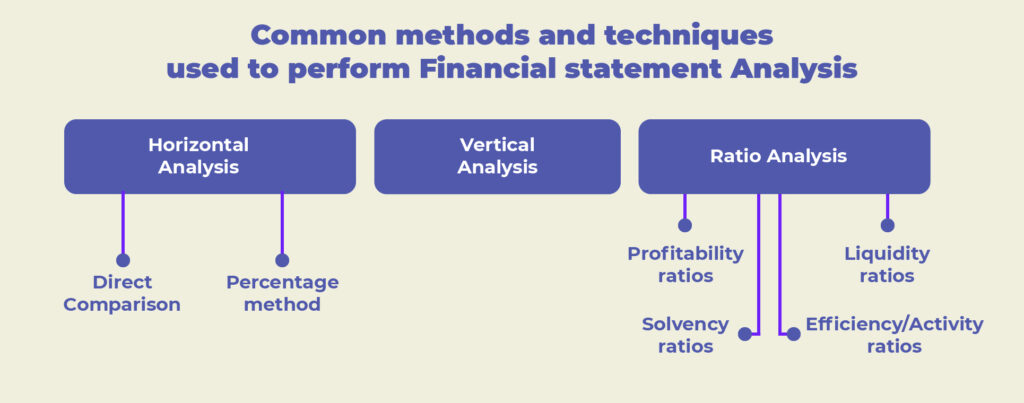
Investigating the health of the business, finding logical explanations for the variances and performing changes based on the positive or negative trends are the ultimate goals of the financial statement analysis. The most common methods and techniques used to perform Financial Statement Analysis are:
Horizontal Analysis
The horizontal analysis, also referred to as trend analysis, is a two-year or multi-year comparison of the financial statements and their elements. This comparison provides the stakeholders with insight into the aspects that could contribute significantly to the financial position or profitability of the organisation. For instance, a company earned Rs. 4 lakhs more than its previous year. This increase in turnover appears to be a positive development at the first glance. However, when it is learnt that the costs of goods and services sold increased by Rs. 5 lakhs resulting in a negative impact of Rs.1 lakh, the positive picture of this additional turnover of Rs. 4 lakhs is changed to a less positive or negative picture.
Horizontal analysis can be performed mainly in two different ways:
- Direct comparison: This type of horizontal analysis compares the profit and loss statement and balance sheet on a line-by-line basis. For example, it compares each line of the financial statements for two or more years to determine the absolute amount by which each line item increases or decreases. This helps you determine which line items need to be investigated further.
- Percentage method: It is generally easier to interpret percentages than absolute amounts under the direct comparison method. You use two periods of financial data and compare the accounts or items by dividing the first year by the second year and converting them into percentages. You will see how much the change was in the second period on a percentage basis.
Horizontal analysis allows you to spot trends or variances in your company’s financial position between years. It shows you where your company is doing well and where you need to give more attention. It is not only helpful to management but also investors and creditors.
Vertical Analysis
Vertical analysis is a financial statement analysis technique in which every line item of the financial statements is listed as percentages, based on a figure within the financial statement. By doing this analysis, insight would be created about the changes in the allocation and distribution of the total assets or the percentage of each expense item to earn one unit of revenue. By representing the different items as a percentage of the total turnover, it’s easy to get insight into the whole company’s or every division’s costs, expenses and profit.
A profit and loss statement vertical analysis provides you with insight into the cost of goods sold, gross margin, operating expenses, operating profit, EBITDA etc. as a percentage of sales for the period. A balance sheet vertical analysis can be used to show the line item percentages of your total assets. For instance, if you have reported sales at Rs. 50,00,000 and cost goods sold at Rs.30,00.000 leaving Rs.20,00,000 as gross profit, it means your gross profit is 40% and cost of goods sold is 60%. Likewise, if you have total assets of Rs. 2,000,000 and Rs.200,000 in cash, your cash is 10% of your total assets. Likewise, if your current liabilities is Rs.500,000, then your current liabilities are 25% of your total assets.
Ratio Analysis
A ratio between two items is used for representing the relationships between different figures on the profit and loss account, balance sheet, cash flow statement or other financial reports. Ratio analysis is used for obtaining a quick insight into the organisation’s financial performance in various key areas and comparing companies that differ in size as well as with the industry averages. Additionally, ratios could be used in the form of trend analysis for identifying the areas within an organization where performance has deteriorated or improved over time. Some of the key ratios include:
- Profitability Ratios: Profitability ratios measure the efficiency and performance of the management. Some of the commonly used profitability ratios include gross profit ratio, net profit ratio, return on equity capital, return on capital employed, operating ratio, earnings per share and dividends yield ratio.
- Liquidity Ratios: These are calculated to ascertain whether a company can meet all of its existing business obligations. The most important liquidity ratios are:
Current ratio: shows the ability to pay off current liabilities (current assets vs current liabilities)
Quick ratio: from the above, subtracts inventory from current assets to express a more strict indicator of the ability to pay current liabilities
Cash ratio: percentage of cash you have for short-term debts - Solvency Ratios: Solvency ratios evaluate the organisation’s ability to meet its long-term interest expenses and also repayment obligations. Common solvency ratios are:
Debt to equity: the amount of equity that can cover debts
Debt to Asset: indicates the percentage of assets that are funded by debt
Interest Coverage: measures the ability of the business to meet its interest charges on debt. Derived by dividing Earnings before Interest and Taxes (EBIT) by Interest expenses - Efficiency / Activity Ratios: These ratios let you know how well your business uses its assets. Common efficiency ratios are:
Inventory turnover: shows how often your inventory is sold and restocked in a period
Accounts receivable turnover: how often your accounts receivable are collected
Accounts payable turnover: measures how fast you pay off your creditors
Total asset turnover: shows how well you use your total assets to generate revenue
Working Capital Turnover Ratio: how effective a business is at generating sales for every rupee of working capital. This is calculated by dividing Sales by Working Capital (Current Assets – Current Liabilities)
‘‘
Industry analysis is valuable because you can get at least a rough idea if the company is on the right track compared to your peers and competitors in the same industry.
If you don’t measure, you cannot improve
Which financial reports should be analysed?
Businesses need constant information on a variety of parameters and trends such as market demand, market share, price, competitive activity and opportunity, cost of production, investment, fund needs, cost of capital, and taxes. Of these, the most vital ones are the financial information such as revenues, costs, profits, capital, salaries, loans and investments.
As explained above, these financial reports commonly and statutorily known as financial statements are to be prepared mandatorily. By learning to read these essential financial statements a lot of valuable and critical information can be gathered by different stakeholders of the company which may include owners, investors, lenders, creditors, the lay public, authorities, financial analysts and other interested parties.
In addition to the three reports discussed above, many organisations prepare, review and analyse various other reports internally. They are better known as management reports and normally not shared with any external stakeholders unless decided to by the management. These reports vary in form and content depending on the industry, size and form of the organisation. The nature of such management reports for a manufacturing organisation is naturally different from that of a company in the service industry.
The management reports are normally customised to the requirements of the management of a company and have no standard norms for it. However, they normally include analysis of working capital, accounts receivable ageing, contribution (sales – variable cost), budgets, budget vs actual variance, standard costing and variance, cost structure, product cost, break-even, life cycle costing, optimal product mix etc depending on the industry, size, type of business and form of the organisation.
The above-mentioned management reports along with the financial statements need to be analysed by companies, small and big, to ensure that the financial foundation and health of the organisation are sound and intact, and deficiencies are identified for taking measures to solve them. Though not exhaustive at all, here are some of the metrics and measurements an entrepreneur must have a grip on.
- Be aware that your company owns enough to pay off what your company owes meaning you have sufficient assets to pay off your liabilities.
- Understand the difference between long term and short term assets and liabilities and hence the urgent and non-urgent liabilities and how they can be taken care of at the required time.
- Be sure that you can meet the expenses and generate enough profits to service capital, debt and equity.
- Importance to be in the know of how much money is blocked with your customers i.e, accounts receivable, and inventory and if it is normal or abnormal as per accepted standards and benchmarks
- Evaluate if your capital or investment is generating the required return
- To have a plan as to when and how much funds you will require to sustain and grow your business in the short-run and long-run
- Know how to price or bid for your products or services or projects
- Get an idea of optimal product mix that will generate profits optimally
- Be sure that the company complies with taxes and other statutory obligations
In addition to the above, you can perform industry analysis to look at a company by comparing the financial ratios to those of an entire industry to see how the company performs in comparison. Periods are matched and industry average ratios are used for purposes of comparison. Industry analysis is valuable because you can get at least a rough idea if the company is on the right track compared to your peers and competitors in the same industry.
How often to analyse?
Financial statements are prepared, reviewed and analysed annually and in certain cases every quarter. For outsiders and external stakeholders, mostly financial statements are the only sources of financial information. Management reports are internal and it is not mandatory to give external stakeholders access to them.
Mandatory or not, all companies must prepare financial statements and management reports every month for proper review and analysis to help you with decision making and devise corrective measures where needed. This is all the more relevant and crucial for small and startup companies because small companies in the early stages cannot withstand even minute disruptions in the market and therefore intensive scrutiny of each item in its financial reports is a must. Annual reports and their review are important but not at all sufficient for conducting the operations successfully particularly of start-ups and small enterprises; it is more of a post mortem.
You can still decide to prepare a balance sheet and cash flow quarterly if your resources don’t allow it to be monthly. However, it is important that at least profit and loss statements, receivable ageing, working capital are generated, reviewed and analysed every month. This is because monthly reviews give you inputs on how your topline and bottom-line are performing vis-a-vis previous year or budget or industry standards, how fast to collect receivables so that you can pay off liabilities on account of supplies and operating expenses without which a business will struggle to survive.